Growth Charts
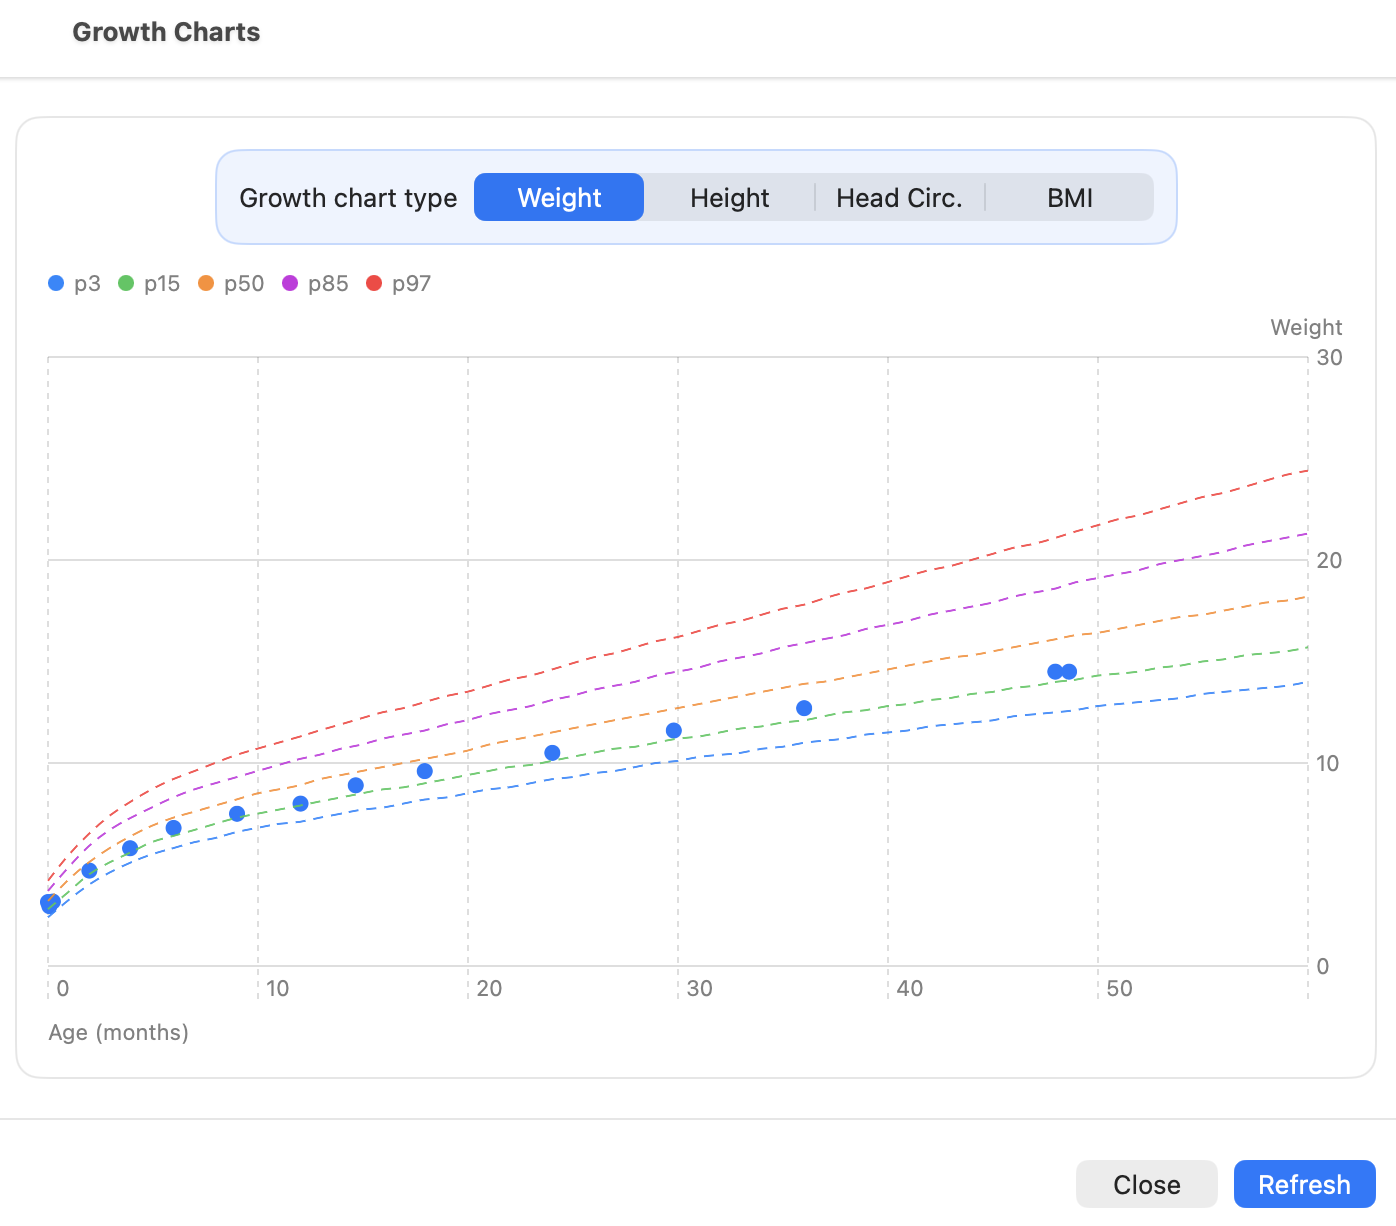
CareFlow Kids generates WHO‑based pediatric growth charts from the measurements recorded during visits.
Growth charts help clinicians evaluate whether a child's growth pattern is normal, accelerated, or concerning for their age and sex.
The system automatically compares measurements against WHO reference standards.
Measurements used
Growth charts are generated from measurements recorded during visits:
- Weight
- Height / Length
- Head circumference
- BMI / Weight‑for‑length
These measurements are recorded in the Vitals section of the visit form.
Multiple measurements over time allow the system to visualize growth trends.
Growth measurements can be added in two ways:
- Manually through the Growth Table in the Growth section of the dashboard.
- Automatically from vitals recorded during visits, including sick visits where weight or other measurements are entered.
The Growth Table therefore serves as the central historical record of all growth measurements for the patient.
Growth standards
CareFlow Kids uses WHO pediatric growth references.
These standards provide:
- percentile curves
- z‑score calculations
- age‑adjusted reference values
The charts are generated separately for:
- boys
- girls
This ensures accurate comparison with the appropriate population reference.
Chart features
Growth charts in CareFlow Kids include:
- Percentile curves (WHO reference curves)
- Z‑score calculation for each measurement
- Growth trend visualization across visits
This allows clinicians to quickly identify:
- growth acceleration
- growth deceleration
- possible nutritional or medical concerns
flowchart LR
    A[Growth measurements<br>Weight / Height / HC / BMI]
    B[Growth table history<br>All recorded measurements]
    C[WHO reference standards]
    D[Percentiles & Z-scores]
    E[Growth charts & trend analysis]

    A --> B
    B --> D
    C --> D
    D --> E
Accessing growth charts
Growth charts can be accessed from the Growth section of the patient dashboard.
The interface allows clinicians to:
- display weight‑for‑age charts
- display length/height‑for‑age charts
- display head‑circumference charts
- display BMI or weight‑for‑length charts
Charts automatically include all measurements recorded for the patient.
Adding growth measurements
Growth data can be entered manually through the Growth Table interface.
This allows clinicians to add measurements collected:
- during well visits
- during external consultations
- from parental records or health booklets
For well visits, it is recommended to record the measurements close to the expected visit date, so that the growth evaluation performed during that visit reflects the most accurate data.
Growth charts in reports
When a well visit report is generated, the relevant growth charts are included in the report.
This allows families to easily visualize the child's growth trajectory.
During well visits, CareFlow Kids also performs a growth trend analysis based on the available measurements.
This analysis may include:
- short‑term weight gain evaluation for young infants
- long‑term growth trajectory assessment for older children
These evaluations help clinicians identify deviations from expected growth patterns early.
Growth charts in CareView Family
When the .pemr bundle is opened in CareView Family, parents can also view the growth charts.
This allows families to:
- track the child's growth between visits
- review charts discussed during consultations
The charts displayed in CareView Family use the same data and reference standards as CareFlow Kids.
Screenshots
Screenshot (TODO)